Studies consistently show that the primary reason millions of households do not have home Internet service boils down to affordability.
Research by EducationSuperHighway indicates that of the estimated 28.2 million households in the U.S. that do not have high-speed Internet service, 18 million of those households (home to 48 million Americans) are not online because the cost of service is simply too expensive.
But now, thanks to a recently published study by the Federal Reserve Bank of New York, broadband affordability advocates may be able to more accurately measure the elusive nature of affordable broadband costs.
The study also examines how to better pinpoint contributing factors like the state of local infrastructure and how lower-performing broadband access technologies powerfully influence low-income households' decision to sometimes choose cellular service-only over home Internet service.
“Broadband Affordability: Assessing the Cost of Broadband for Low-and-Moderate Income Communities in Cities” provides a research-driven lens on how to measure broadband affordability neighborhood by neighborhood, city to city.
“While national and state-level analyses have helped highlight the digital divide,” the study’s author Ambika Nair writes, “measures of broadband affordability at the community level are limited.”
To address those limits, Nair introduces “a novel measure of relative broadband affordability,” which can then be used by digital inclusion advocates, “to compare a community’s broadband affordability relative to other communities in the same city.”
“The findings from analyzing broadband affordability using a community-level measure of price relative to local median household income illuminate how affordability challenges are distributed across cities, how broadband costs compare to other essentials in the household budget, and how acutely broadband affordability impacts urban low-and-moderate income neighborhoods.”
How to Measure Relative Affordability at the Community Level
The study begins with the Federal Communications Commission (FCC) 2016 “broadband affordability benchmark” – pegged at 2 percent of monthly household income.
The problem with the FCC benchmark, the study says, is that it “does not consider local costs of living and median household income, which influences the ability of a household to pay for broadband.” Though, it’s worth noting that some digital equity researchers argue that pegging affordability to income is the wrong approach altogether, pointing to surveys that show how disposable income is so scarce for households in the bottom brackets that even $10/month for a connection can be difficult to manage.
Using the national dataset collected by The Markup in its seminal investigation “Dollars to Megabits,” the Federal Reserve study notes how the average monthly price of a broadband connection is “relatively standard across each census tract type hovering at a price of about $60.”
The scope of addressing the challenge comes into view against the backdrop of household survey data, which indicates that one-third, or 34 percent, of low-income households say that the “typical” price of $60 per month is too expensive for their household budgets while 56 percent of households say $75 or more is too much, the study says.
“Yet, half of low-income households pay more than $60 per month for service, indicating that for many that service fee imposes a strain on the household budget,” the study reports (bear in mind, this data was collected in 2022 and most, if not all, of the big Internet service providers have instituted at least two price hikes of $10/mo each since then).
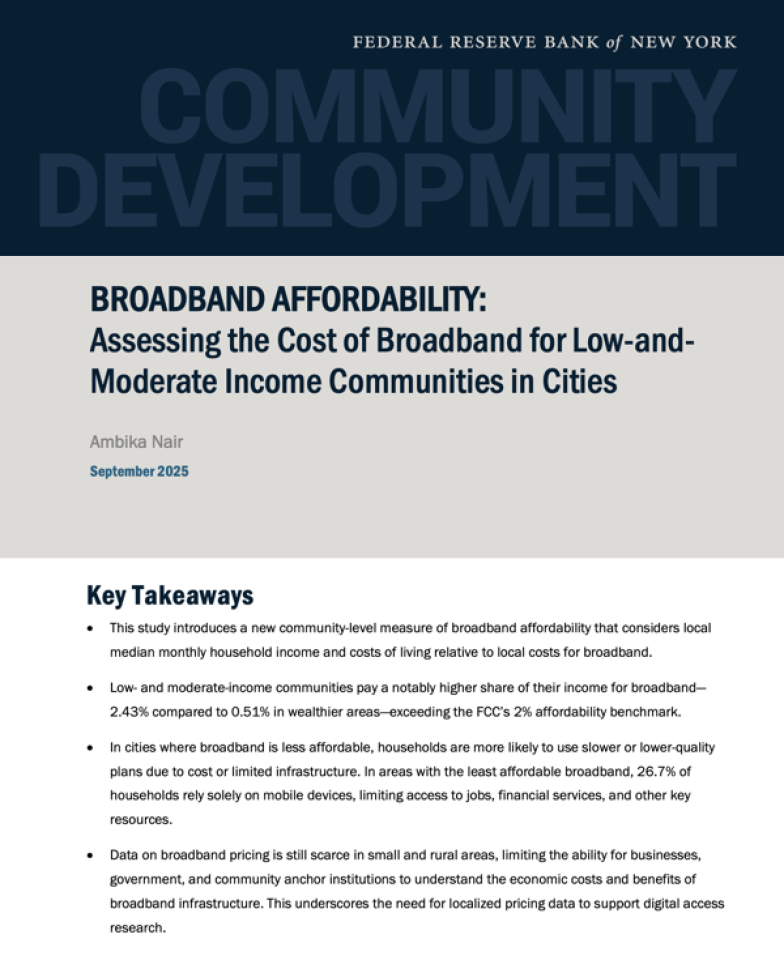
In any case, a deeper dive into the numbers shows that “low- and moderate-income households pay over four times more as a share of their monthly median household income on a broadband connection relative to middle- and high-income families.”
What that means in terms of household budgets is that those cash-strapped households are looking at broadband costs of 2.43 percent of household income compared to 0.51 percent in wealthier areas, which, the study notes, “is a significant monthly cost for low- and moderate-income families to dedicate to broadband alone and surpasses the 2% affordability threshold set by the FCC.”
To better grapple with affordability, the study puts forward a method for determining relative broadband affordability (emphasis added) by analyzing “monthly broadband prices as a share of median household income, as this measure is more reflective of a household’s ability to pay for broadband, particularly in the context of their existing income constraints. This is particularly true for cities.”
It’s an important insight because while “broadband prices may not be significantly different in adjacent or nearby census tracts…these prices as a share of household income in a low-and-moderate income census tract relative to a middle-and-high income census tract will likely influence whether a household is likely to adopt broadband while balancing other important household costs.”

But not only does the study offer a formula for how to calculate relative broadband affordability at the community-level, it also points to the importance of comparing prices in different census tracts within the same city, which can help determine “the most to the least relative broadband affordability” rates across an entire city.
Following the formula laid out in the study, it can provide a window into how affordability will look different across different cities, “depending on the local costs of broadband, local median incomes as well as local costs of living.” As an example, the study notes, "the threshold for communities in New York City who experience the lowest relative broadband affordability (rates) ranges from 1.89 to 2.45%, while in Detroit, the same threshold ranges from 3.15% to 6.10%.”

The study, however, doesn’t limit itself to New York City and Detroit alone. It also examines six cities in the northeast (Boston, Bridgeport, Newark, Philadelphia, Providence and Wilmington, DE) and shows how “income influences affordability even while prices remain consistent,” noting that, of those six cities, Bridgeport, CT had the least affordable broadband.
Where Infrastructure Fits Into the Equation
Beyond calculating how affordability can be better measured at the census tract level, the study goes on to highlight “the relationship between broadband technology and broadband pricing, where fixed wireless and DSL offer the lowest speeds, cable offers middle-range speeds, and fiber offers the highest speeds.”
The intersection of infrastructure investments and affordability is a crucial nexus, the study explains, because “low-and-moderate income households that choose to purchase a monthly broadband subscription may opt for cheaper, lower quality plans that rely on poorer performing technologies like DSL or copper to be able to afford it given existing budgetary constraints.”
It underscores why the link between infrastructure and the affordability challenge cannot be simply breezed over.
“Cities with less affordable broadband relative to their monthly median household income often experience lower download speeds, particularly in their low-and-moderate income census tracts. In other words, broadly speaking, low-and-moderate income households in urban areas often face the two-pronged issue of lower quality broadband and higher prices relative to their monthly median incomes.”
That finding reflects what the national Markup investigation found and was also aligned with what was reported in a study published by Digital Equity LA that documented how “people who live in higher poverty neighborhoods (in Los Angeles) are not only routinely offered slower service at higher prices, but are offered contracts with worse terms and conditions.”
Even beyond what kind of broadband access technology may or may not be available in certain areas within the same city, the study reveals how broadband affordability influences whether households decide to subscribe for home Internet service or rely on mobile access only, finding that “in census tracts where broadband is the least affordable for households, 26.7% of households opt to use only their mobile device for Internet connection and 3.5% of households have no Internet connection at all.”
And while mobile only access may make sense for financially-strapped households, the problem, as the study notes, is that “exclusive reliance on a mobile phone can often limit low- and moderate-income individuals from reliably accessing vital services and opportunities for economic and professional advancement” – aside from the fact that “mobile connections typically come with data caps, slower speeds, and less reliable service, making it difficult to complete tasks like applying for jobs, accessing remote education, attending telehealth appointments, or using online banking and financial tools.”
Who Owns the Infrastructure Matters
Finally, the study hints at something ILSR has repeatedly shown: in places where the city, town, or nonprofit entity owns all or part of the Internet infrastructure, it can make a dramatic difference in terms of affordability.

In New York City, the study says, the lowest relative broadband affordability rates can be found in upper Manhattan, the Bronx, Southern and Eastern Brooklyn, and Queens – in communities that are largely “communities of color, with aging housing infrastructure.”
Unfortunately, the study notes, “for many residents, high-quality broadband infrastructure is available, but the cost is too high. In some cases, families pay hundreds of dollars per month for subpar service.”
In addressing the affordability crisis in New York, the study points to “community-led broadband solutions” as a promising avenue such as NYC Mesh, “a nonprofit building an open, affordable wireless network across the city.”
Elsewhere, the study notes, how in Newark, N.J. the city “has taken a number of steps to address broadband affordability constraints, including expanding a municipally run network called Newark Fiber that initially served anchor institutions like libraries and community health centers but has now expanded to residential areas, including public housing. The network includes 12 public housing buildings where residents can access Internet (service) for $20 a month, impacting about 1,600 low-and-moderate income families.”
More Measured Guidance
As broadband affordability advocates in states across the nation work to advance legislation similar to New York’s Affordable Broadband Act – which requires Internet service providers of a certain size to offer income-eligible households an affordable monthly plan – the study offers another arrow in the quiver and helps make the case for state and local action.
“Broadband adoption brings economic and social returns to households, particularly low-and moderate income households. Internet access provides opportunities for economic mobility through job seeking and professional development, and access to vital services such as online banking and telehealth.”
“In many places, particularly low-and-moderate income metropolitan neighborhoods, broadband affordability is the final barrier to broadband adoption. This means that interventions that bring down the cost of broadband for low-and-moderate income families can have compounding social and economic returns to low-and-moderate income households and communities.”
Header image of couple fretting over bills courtesy of Pexels, Public Domain
Inline image of Federal Reserve Bank of New York cornerstone courtesy of Cornerstones of NY on Flickr, CC BY-NC 2.0, Attribution-NonCommercial 2.0 Generic
Inline image of No Wifi WTF written on window courtesy of Regan Wright on Flickr, CC BY-NC-SA 2.0, Attribution-NonCommercial-ShareAlike 2.0 Generic

